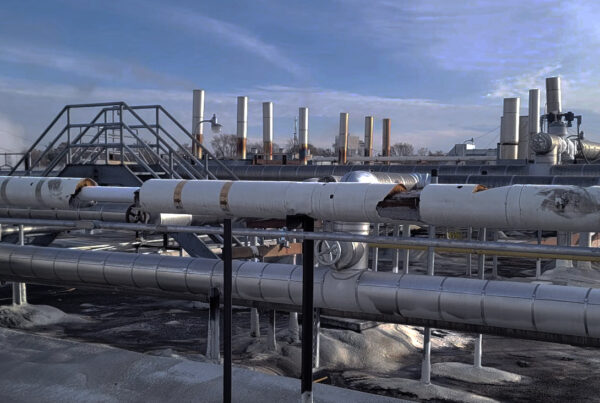
After speaking to a group of plant managers at a national beverage company, one of them invited us to his cold storage warehouse in New Jersey. He walked us to the roof of his ten story facility overlooking the Hudson River on a bright, sunny day. The manager had directed his staff to avoid the area while we were testing, so it was just our team of two and Lady Liberty.
We were brought in specifically to inspect the plant’s most susceptible line to corrosion, a 40 year-old hot gas defrost line. Given the relatively small testing area, we used the Profiler to scan the entire 110’ of pipe in a few hours, as opposed to our normal day-long procedure involving spot checking numerous areas on thousands of feet along the HPL, suction, HGD, and DC lines.
The results for the majority of the pipe were straightforward, indicating everything was within tolerance. However, we were intrigued by two sections where the Profiler readings differed. We found a six foot segment where the pipe itself was thinner than the rest of the line, and a four inch section where there was a noticeable change indicated by the Profiler.
The Profiler detected welds at either end of the six foot segment, which helped make sense as to why there might be a difference in that area. But there were other welded sections, so that alone was not the reason for the reading variance. As for the four inch portion, there were no weld indications, so we were unsure why the readings were lower there—but we could tell something was different.
The plant manager returned a few hours later, surprised to find us already finished and discussing our findings. He asked if it was safe to be on the roof at that point. Having used conventional X-Ray testing in the past, he expected radiation barricades to be in place and had banned his workers from the area. But with the Lixi Profiler, it had been safe the entire time, as no radiation exposure hazard exists with this form of testing.
We explained the safety difference in our form of non destructive testing, and he asked what we had found. We first reviewed the variance we found in the 4 inch area of the pipe. He had not noticed anything odd about that portion of the pipe previously and wondered how we discovered the irregularity.
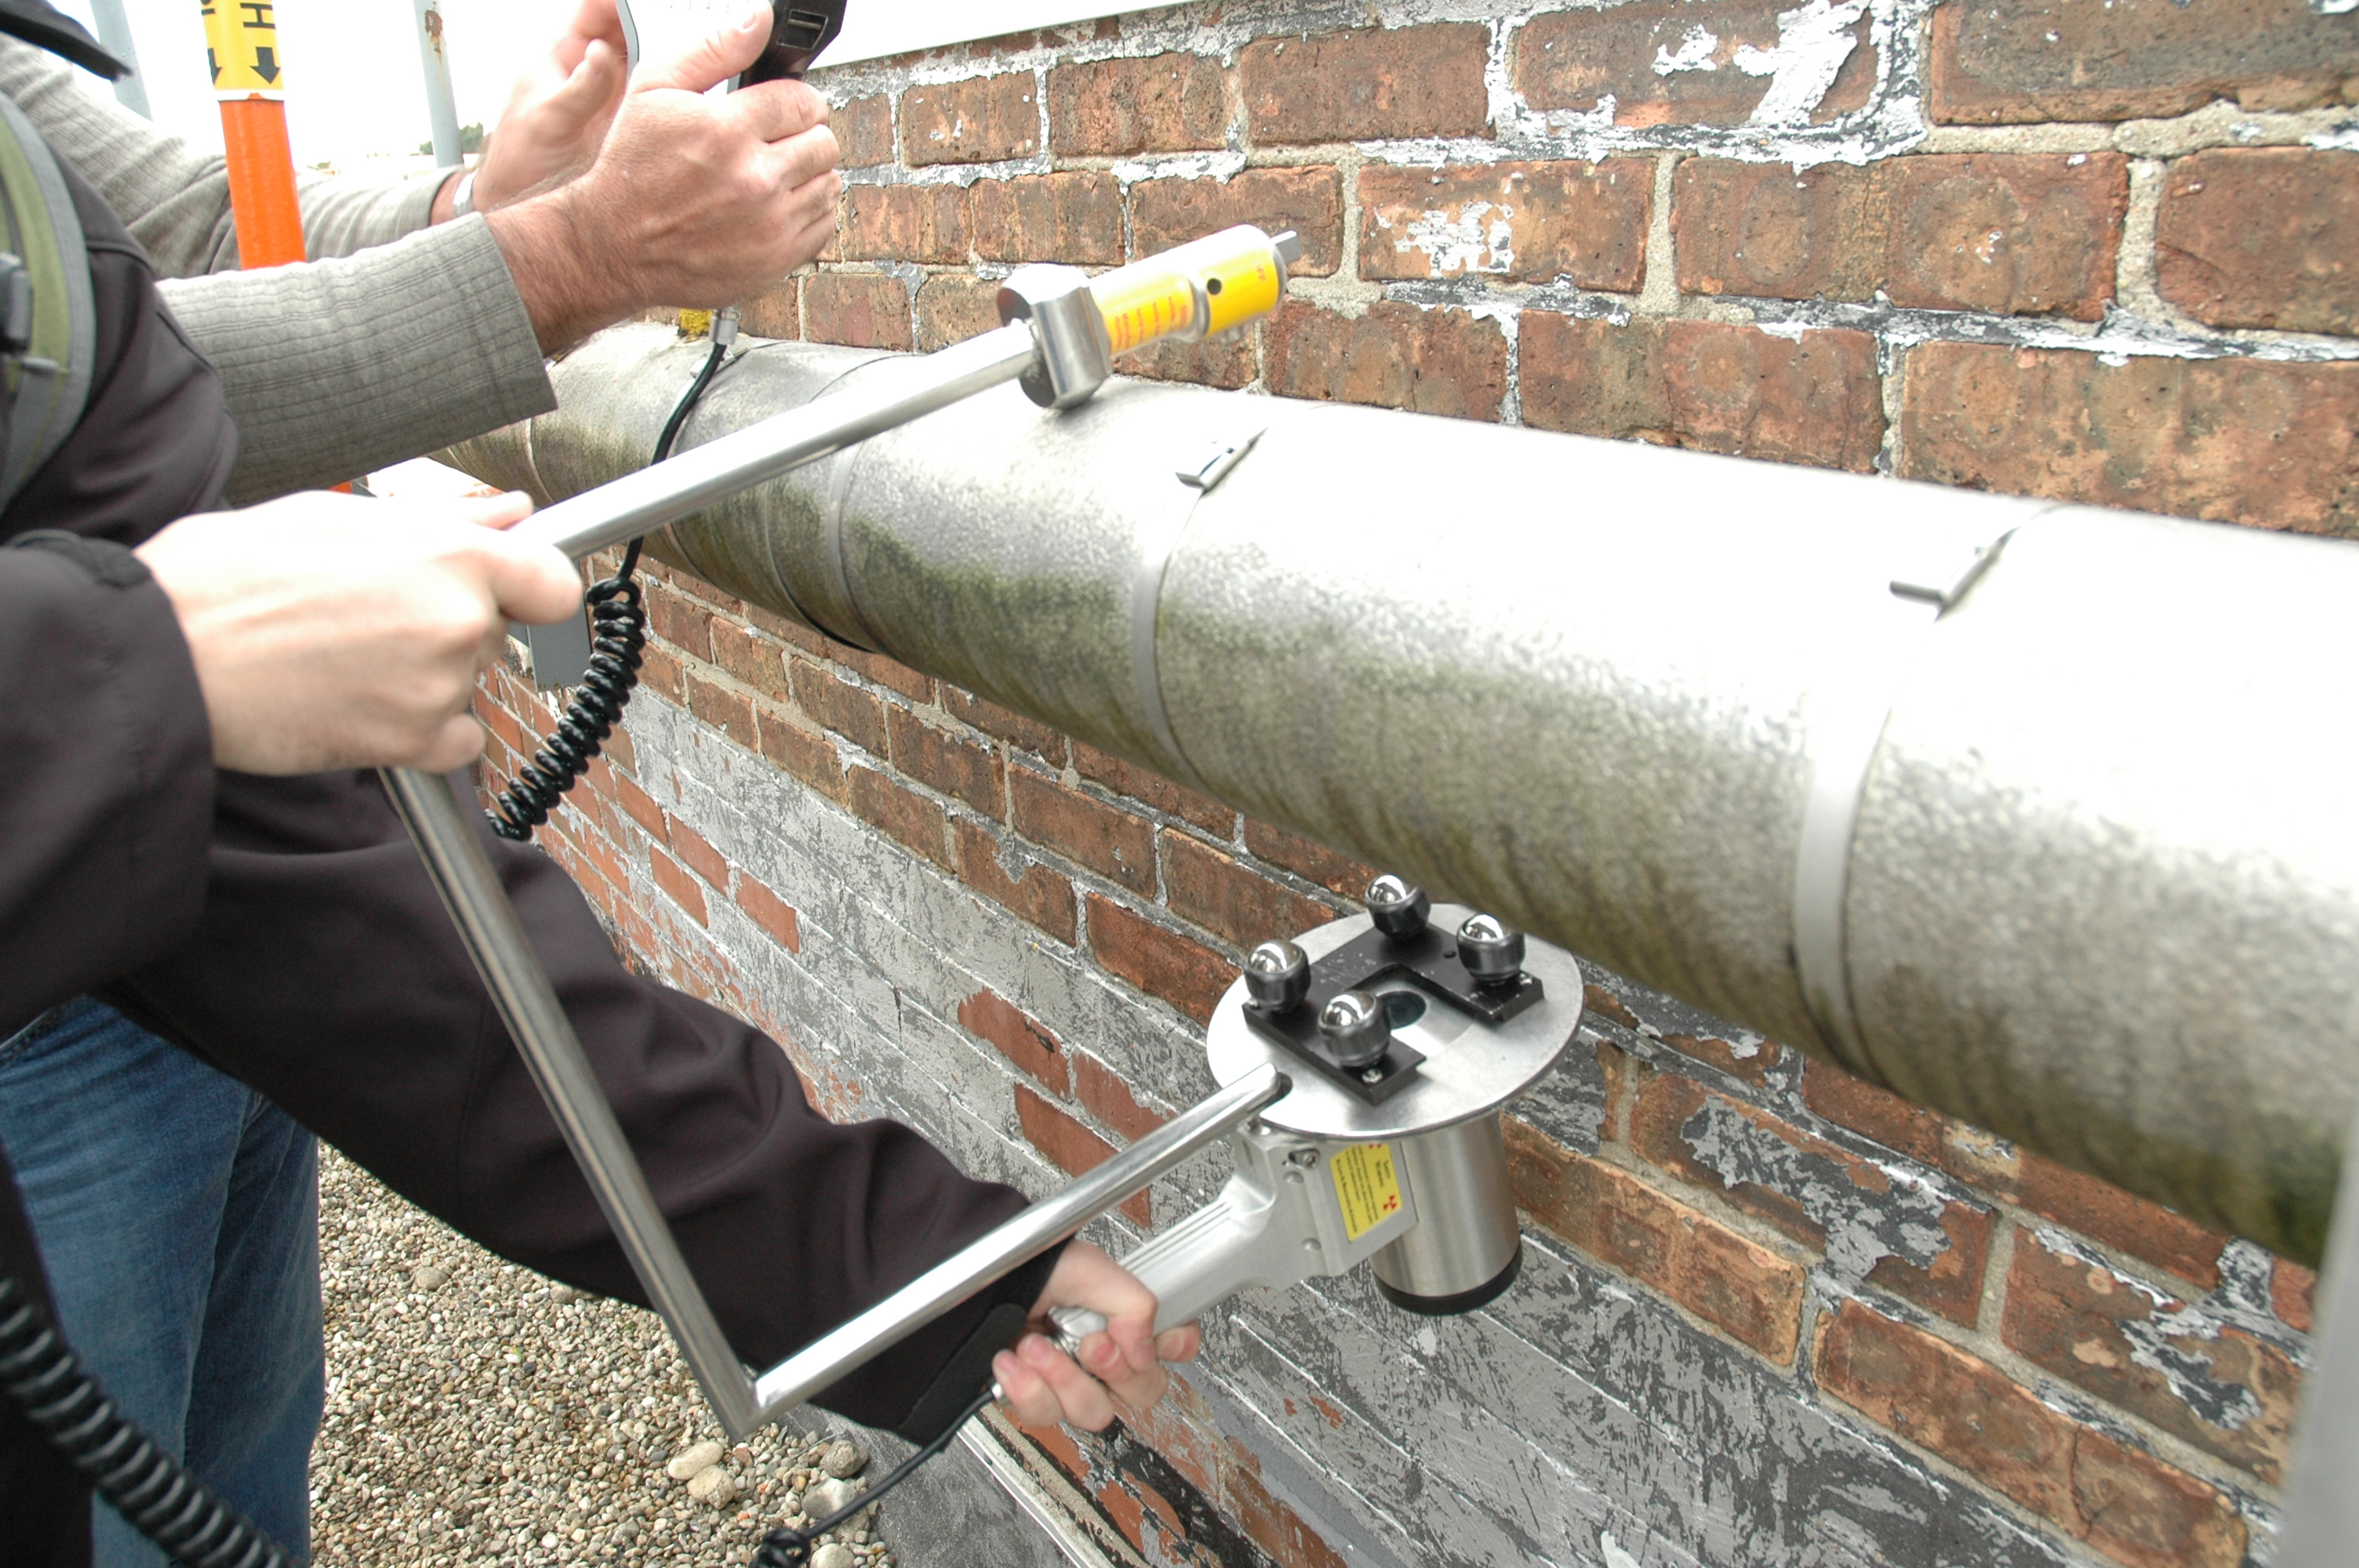
“Well, let me show you how this works,” I said, and we walked over to that portion of the pipe with the Profiler. I scanned an area right next to the 4 inch outlier that registered in the same range as the majority of the pipe and let him view the results that immediately showed on the Profiler’s screen. I repeated the process on the four inch section.
His countenance quickly changed.
In less than a minute, he had looked at data for two neighboring sections of his pipe, seeing a noticeable difference between the two. With his permission, we cut into the plastic jacketing and discovered there was no insulation present in the four inch segment. Now we knew why the readings were different for this section—the Profiler was sensitive enough to have noticed missing insulation.
Astonished by the speed and sensitivity of the Profiler’s results, he declared, “If you can find an area this tiny that lacks insulation, you can certainly find any other issues in my plant’s pipes.”
He was convinced by what he had seen, and since that time we have inspected multiple plants within the company.
In the meantime, however, we wanted to find out why the six foot segment of the pipe that had been welded in was found to be thinner than the rest. We repeated our measurements with the plant manager on hand, and then took the results back to the lab for some research.
Read Old Pipes vs. New: They Just Don’t Make ‘Em Like They Used To to learn more about what we found.